SPOT on Features: Data Visualization
(SPOT Tracker and TruQC have joined forces to become TRU, a Jones Company)
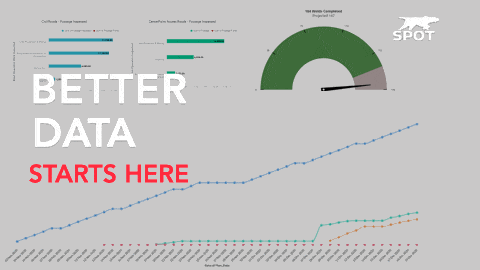
We’ve all heard the adage “less is more.” Well, we respectfully disagree. We think more is more. Actually, we think more is better, at least when it comes to data. The more data you have, the more equipped you are to make better decisions. And better decisions can translate into a multitude of positive outcomes, such as greater productivity, error reduction, efficiency, cost savings, and a deeper, more holistic understanding of your project writ large. The more information you have about something, the better you understand it. So what are we getting at? Digital representation. In other words— visual aids.
You remember them from your high school science fair, right? The print-outs you had to glue onto your tri-fold poster board. Imagine that on steroids and you’ve got SPOT. It’s one thing to be the leader in data capture technology, but it’s another entirely to be able to present that data in a way that is easy to see and simple to understand. You may be asking yourself why being able to see data in a picture is really a big deal. We’ll tell you: science.
- Visual aids are held in your long-term memory bank
- According to Dr. Lynell Burmark, “unless our words, concepts, and ideas are hooked onto an image, they will go in one ear, sail through the brain, and go out the other ear. Words are processed by our short-term memory where we can only retain about seven bits of information… Images, on the other hand, go directly into the long-term memory where are indelibly etched. Visual aids transmit messages faster
- Visual aids transmit messages faster
- The brain can see images that last for just 13 milliseconds
- Our eyes can register 36,000 visual messages per hour
- We can get the sense of a visual scene in less than 1/10 of a second
- 90% of information transmitted to the brain is visual
- Visuals are processed 60,000X faster in the brain than text
- Visuals improve comprehension
- Visuals have been found to improve learning by up to 400%. Also, they affect learners on a cognitive level and stimulate imagination, therefore enabling users to process the information faster.
The point is that visual representation of your data is simply better, more effective, and easier to understand. More data means better information. More information means better measurables. More measurables mean better management. Better management means better results.